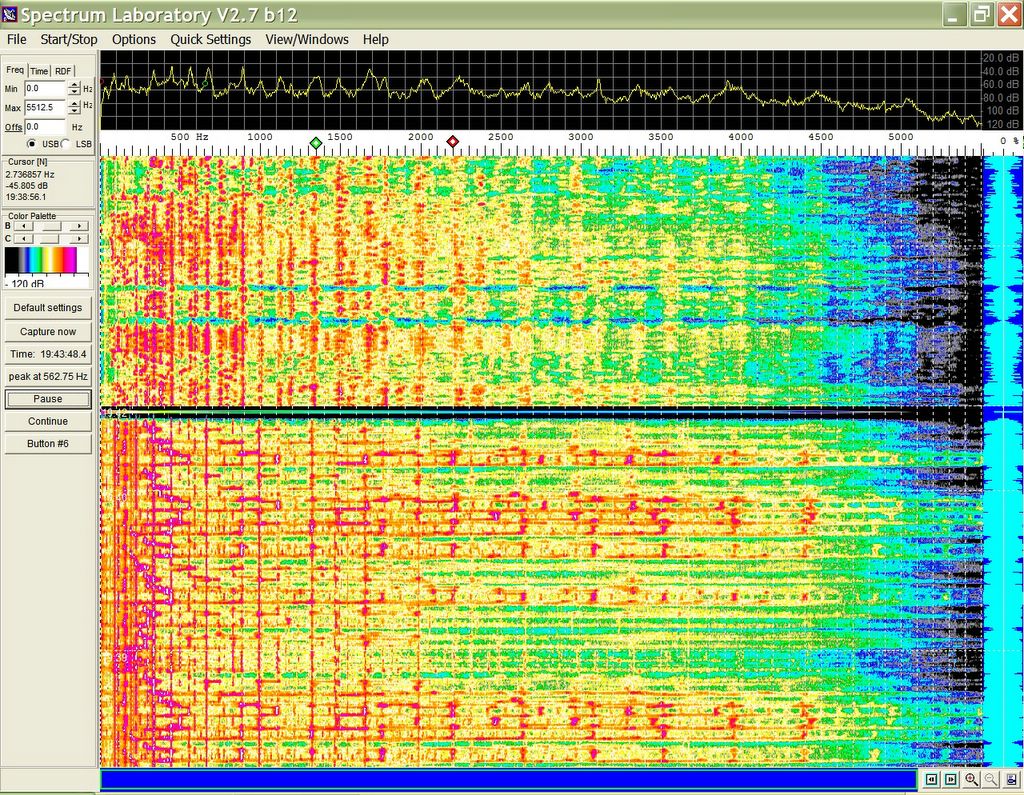
The upper section of this graph is a classical piece the lower section is Ron Block & Alison's "A Living Prayer"
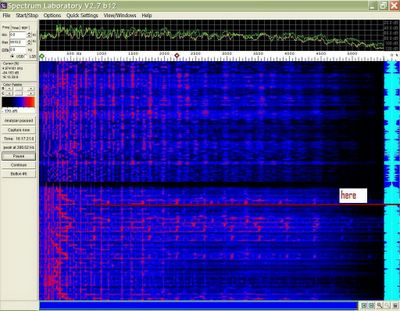
I inserted a line and the word "here" to mark where Alison sounds harsh to me.
To do this measurement I ran a CD player into a line level input on my sound card and then started the Spectrum Lab software..
Now, do I understand this correctly, that the amplitude graph shows peaking in both pieces of music but more so in Alison's song? And certainly where I notice a harsh sound? Couldn't this cause harshness?